- Weekly Wizdom
- Posts
- Who Was in Paris?
Who Was in Paris?
Issue #116
Good morning!
The focus has shifted from tariffs to the talks between the US and Russia and meetings in Europe regarding the war in Ukraine. We have FOMC minutes today, and Germany's election is on Sunday. Other than that, the rest of the week looks thin regarding important data releases.
This week, our technical analysts provide trading plans on the following crypto tickers: ENS, LTC, XRP, HYPE, SOL, and TAO. On the equities front, we discuss ideas on BIDU, SQ, GRAB, and OSCR. Read the plans carefully, note the suggested interest levels, set your alerts, and wait for them to play out. Enjoy!

We are still holding positions from last week! Stay tuned as we update our good calls!


Understanding Bitcoin Pairs
Today, I’ll teach you a new way to analyze the market and determine whether buying a specific alt is worth it. That way involves using Bitcoin Pairs.
Most people open their charts and look at all their coins priced in dollar terms. SOL/USDT, ETH/USDT, etc. But this can quickly lead to major underperformance. That’s because, in many cases, alts perform worse than Bitcoin.
BTC is the baseline of the crypto markets. If your coin isn’t making you more money than Bitcoin, there’s zero reason to own it. Alts run a higher risk of downside than BTC, so if the upside isn’t greater, you end up with all the risk and none of the reward.
This also allowed us to remain highly allocated to Bitcoin and outperform much of the market during this cycle when most people aggressively bought altcoins.
Take the following example for Solana. In contrast, there have been some pumps and opportunities to play the upside on the USDT pair (see image).

SOL/USDT - Weekly Chart
When we focus on the Bitcoin pair, the SOL/BTC chart, we see that while there were some opportunities, we could see well ahead of time that SOL would start underperforming.
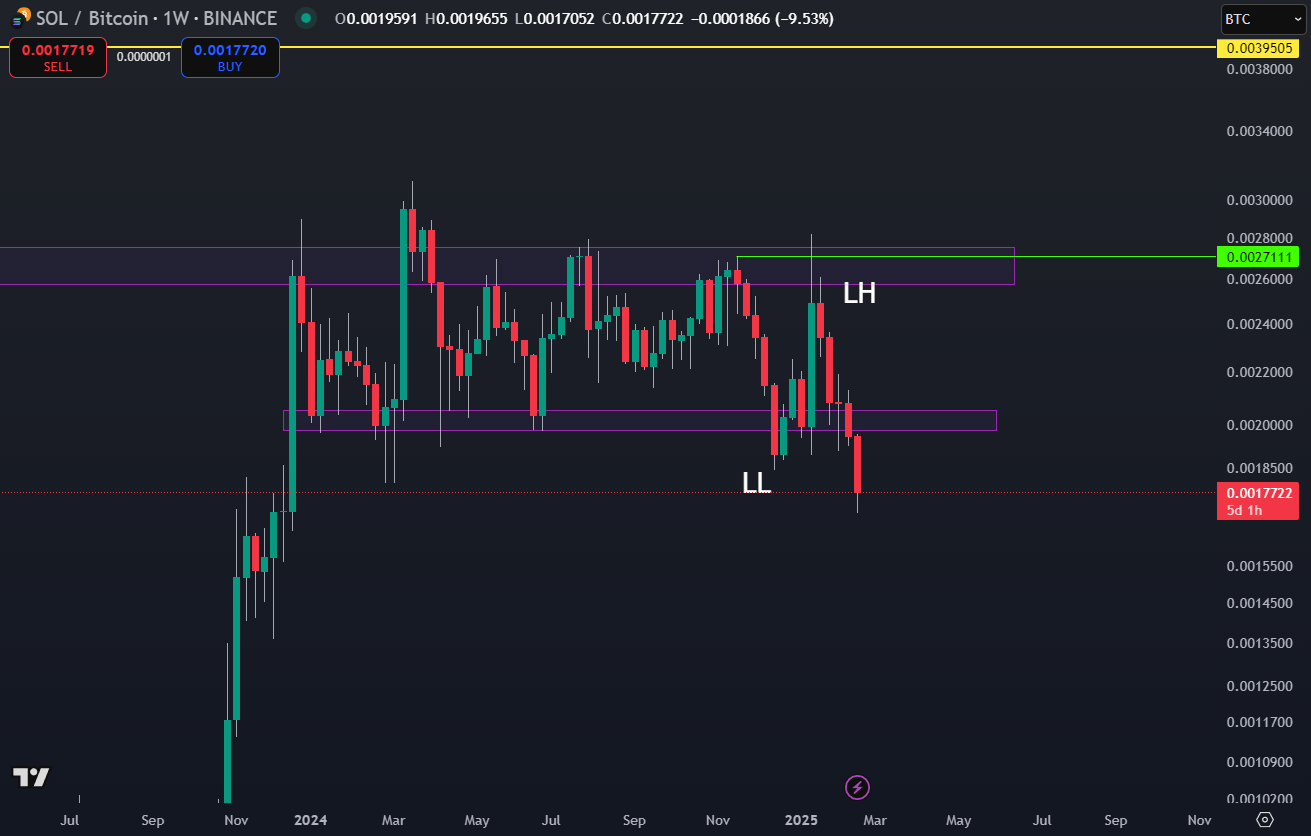
Solana Weekly Chart, priced against Bitcoin instead of USDT
You got the lower highs & lows for the reversal, a liquidity sweep before the high, so it dumps down.
When we want to buy an altcoin, we check the altcoin’s price against Bitcoin instead of just USDT. What we’ll often find is charts like this where it tells us the coin is not worth buying.
Trading Bitcoin Pairs
While we can use BTC pairs to check whether an altcoin is worth buying, we can also use them to trade when the market doesn’t offer us many great setups.
Take, for example, the ETH/BTC chart; Ethereum and Bitcoin went up this cycle, but BTC simply pumped much more than ETH. We couldn’t just short ETH because it still went up, but what we could do is this:
Open a long on BTC for, say, $100,000, then open a short on ETH for $100,000. Here, the profit is no longer determined by whether something goes up or down but instead comes from the relative performance between the pairs.
If both coins dump but BTC dumps 10% and ETH dumps 20%, our long on BTC would be down 10%, but our short on ETH would be up 20%. If both coins pump, our ETH short would lose, but we're profitable as long as it loses less than the BTC long prints.
Note that while this opens many new doors of opportunity, it also adds a unique risk.
A play like this must be done on futures with liquidation risk. You should always keep an eye on your liquidation levels in these circumstances.
Secondly, you’ll still need to have a stop loss on these as you would normally, but you cannot set this to happen automatically on your exchange.
This technique of looking at a ticker compared to another, as opposed to their usual currency, can be used on more than just Bitcoin. If you have two altcoins you’re trying to choose between, consider opening a chart that divides those two altcoins as per the example below.
You want to buy either SOL or XRP. In this case, you’d go on TradingView, select the ticker search box, look for SOLUSDT/XRPUSDT, and then press enter. If it doesn’t already exist, it will generate a custom pair chart for you.*
*Custom formulas require a TV subscription.
Closing Thoughts
Bitcoin and custom pair charts are a way to find an edge in the markets where most don’t think to look. It offers a clean way to determine what you should and should not be allocated to and find trades even in sideways and choppy markets.
I highly suggest checking it out for those who want to get the most out of their money.
REFERENCES
Disclaimer
Wizard of Soho LLC and Weekly Wizdom publish financial information based on research and opinion. We are not investment advisors, and we do not provide personalized, individualized, or tailored investment advice, nor do we provide legal advice or information. The publisher does not guarantee the accuracy of the information provided on this page. All statements and expressions present are based on the author's or paid advertiser's opinion and research. Directly or indirectly, no opinion is an offer or solicitation to buy or sell the securities or financial instruments mentioned.
As news is ever-changing, the opinions included should not be taken as specific advice on the merits of any investment decision. Investors should pursue their investigation and review of publicly available information to make decisions regarding the prospects of any company discussed. Any projections, market outlooks, or estimates herein are forward-looking and inherently unreliable. They are based on assumptions and should not be construed to be indicative of actual events that will occur.
Contrarily, other events that were not considered may occur and significantly affect the returns or performance of the securities discussed herein. The information provided is based on matters as they exist on the date of preparation and do not consider future dates. As a result, the publisher undertakes no obligation to correct, update, or revise the material in this document or provide any additional information. The publisher, its affiliates, and clients may currently or foreseeably have long or short positions in the securities of the companies mentioned herein. They may, therefore, profit from fluctuations in the trading price of the securities. There is, however, no guarantee that such persons will maintain these positions. Unauthorized reproduction of this newsletter or its contents by photocopy, facsimile, or any other means is illegal and punishable.
Neither the publisher nor its affiliates accept any liability for any direct or consequential loss arising from any use of the information contained herein. By using the website or any affiliated social media account, you consent and agree to this disclaimer and our terms of use.