- Weekly Wizdom
- Posts
- Monthly Report: January 2025
Monthly Report: January 2025

United States
Strong resilience of the labor market, rate cuts, and the cooling of inflation should help the housing market in the US. However, the higher mortgage rates and reduced affordability mean this could be another year of sluggish home sales. The consensus seems to be that 2025 will look a lot like 2024 for housing in the US, as an elevated rate environment seems most likely. Indeed, it’s hard to see sustained growth in house prices with high mortgage rates. Mortgage rates have ticked up on the back of a rally in bond yields, mainly due to higher inflationary expectations from Trump’s policies.
New home sales increased by 3.6% month over month to 698,000 at the end of 2024, the highest since September and beating expectations for 670,000.
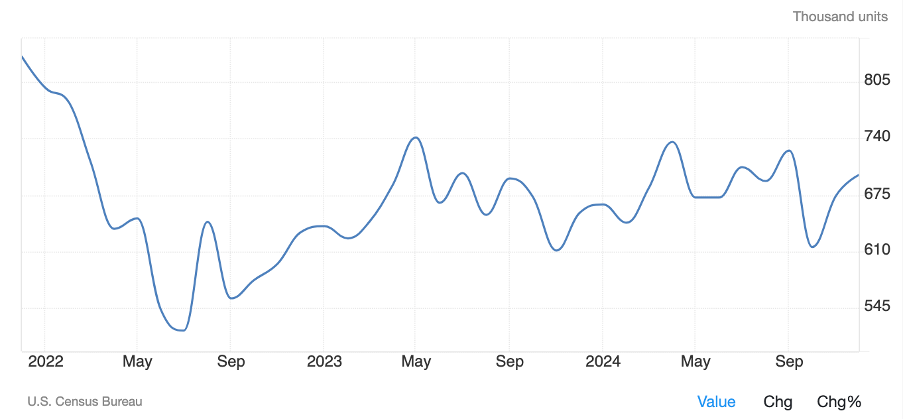
New Home Sales. Trading Economics, 2025
US Existing home sales increased by more than 2% month-on-month to a seasonally adjusted level of 4.38m units, the highest since February 2024. We have seen a strong recovery in existing home sales reported for the last quarter of 2024, which, normally based on seasonality, is quite unusual and, therefore, very positive. Zooming out, sales are still subdued compared to the peak months of 2021, reflecting the increase in borrowing costs.
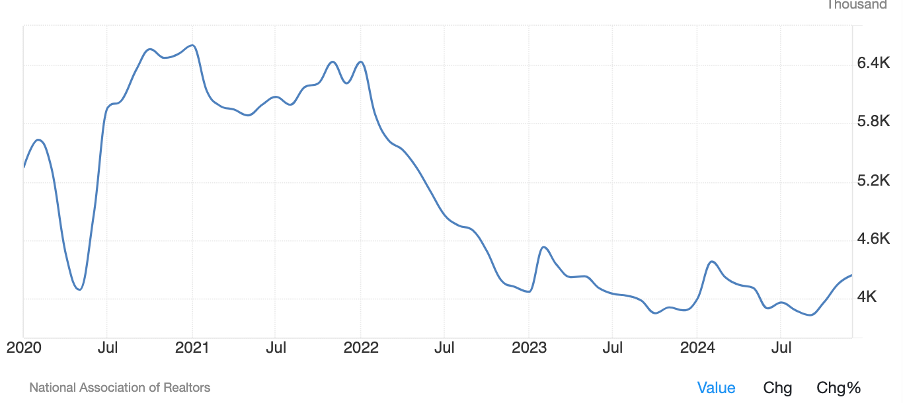
Existing Home Sales. Trading Economics, 2025
The total Housing inventory in the US has dropped 3% month-on-month to 1.33m. We finally saw a draw in inventory after 10 consecutive increases; however, we have still been at the highest inventory level since late 2020.
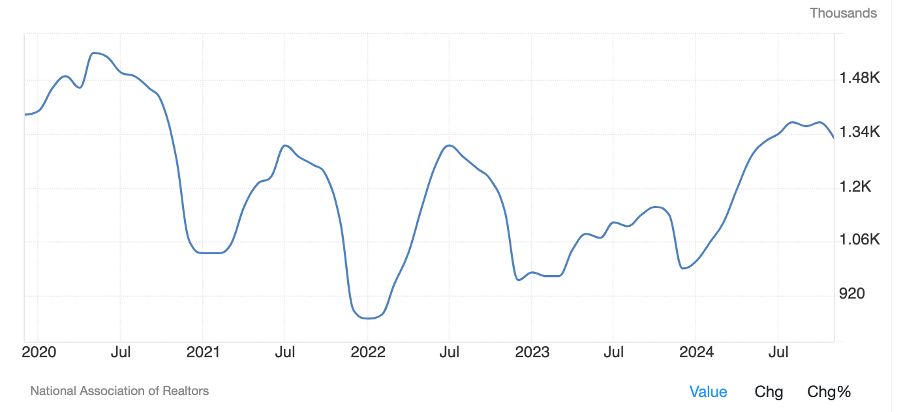
US Total Housing Inventory. Trading Economics, 2025
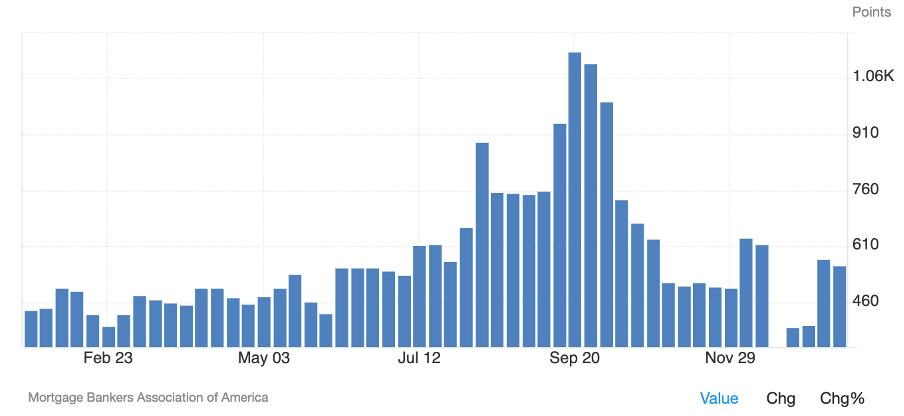
Mortgage application volumes during this month showed strong growth. Last week, they increased by 33% week-on-week, which has remained stable. This is the highest weekly increase since 2020. The increase in mortgage interest reflects the pullbacks in long-term yields, as we saw moderate inflation in the US.
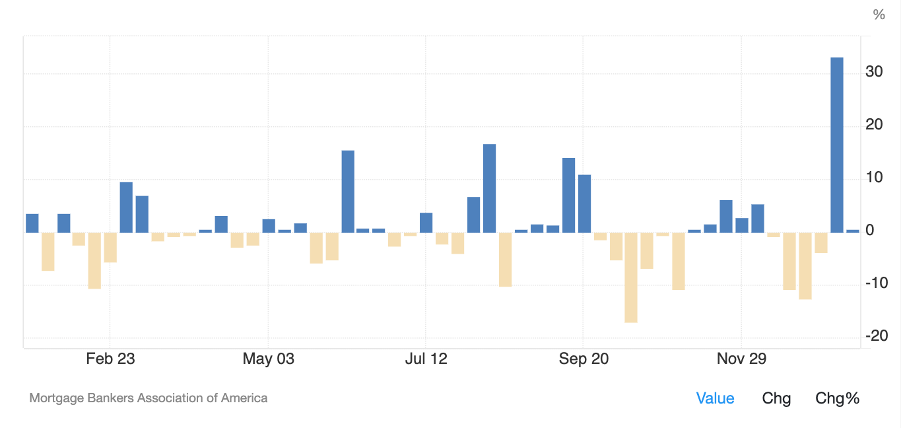
Mortgage Applications. Trading Economics, 2025
The Mortgage refinancing index has continued its overall downtrend after peaking towards the end of September.
Mortgage Refinancing Index. Trading Economics, 2025
The average 30-year fixed-rate mortgage is around 5bps higher this month, continuing its uptrend and remaining at its highest since June.
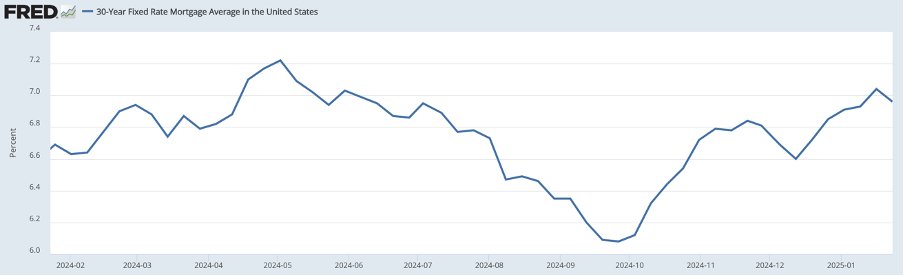
FRED, 2024
It's a very similar picture for the 15-year mortgage rate.
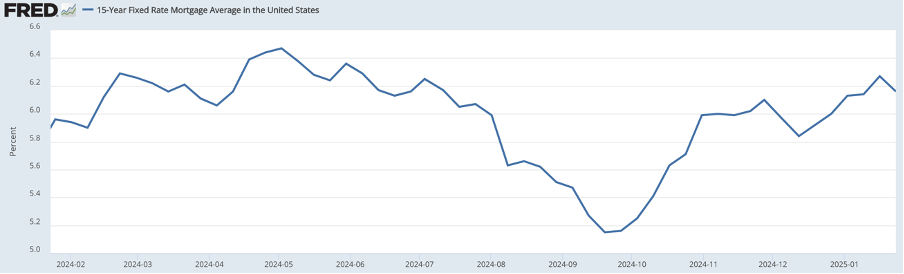
FRED, 2024
United Kingdom
The UK economy is in a mixed situation. The BoE continues to cut rates while inflation surprises slightly on the downside. On the other hand, unemployment ticked up in January’s print, and retail sales came out worse than expected, showing a contraction month on month.
The Nationwide House Price Index increased further by 4.7% year-on-year in December, the fastest growth since October 2022 and a 0.7% increase month-on-month. House prices are just in sight of their all-time highs recorded in the summer of 2022. We have now seen 12 months of consecutive YoY growth, with most being higher than 2% and an exceptionally strong Q4. It is worth noting that the upcoming stamp duty change incentivizes many transactions and could partially cause a price jump.

House Price Index YoY. Trading Economics, 2025
The Halifax price index disappointed this month, showing a contraction month-on-month of -0.2%, compared to the 0.8% expected, and a 3.3% increase year-over-year, compared to the 4.6% expected. This was the first drop Month-on-Month after nine months of consecutive growth.
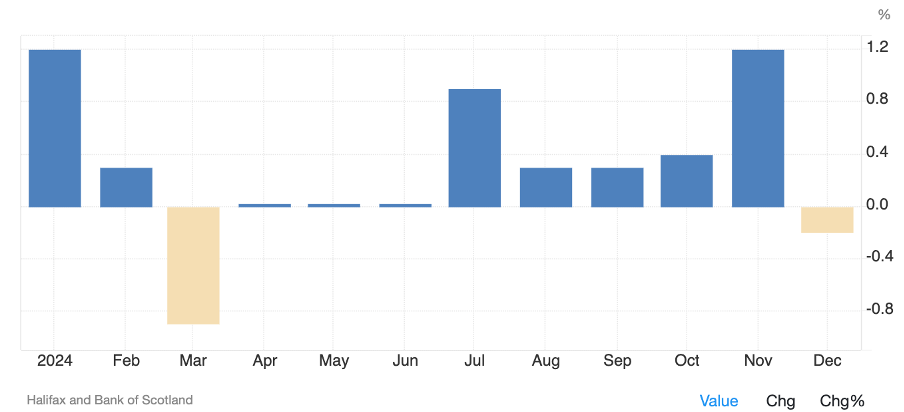
Halifax Price Index MoM Growth. Trading Economics, 2025
Mortgage approvals and mortgage lending both came out lower than expected.
Mortgage approvals remain at levels last seen in September 2023.

Mortgage Approvals. Trading Economics, 2025
The RICS UK Residential Market Survey's house price balance continues to increase, with a growth of 26% in November, up from +16% in October, 11% in September, and 0% in August. This is also the highest level in the last two years.
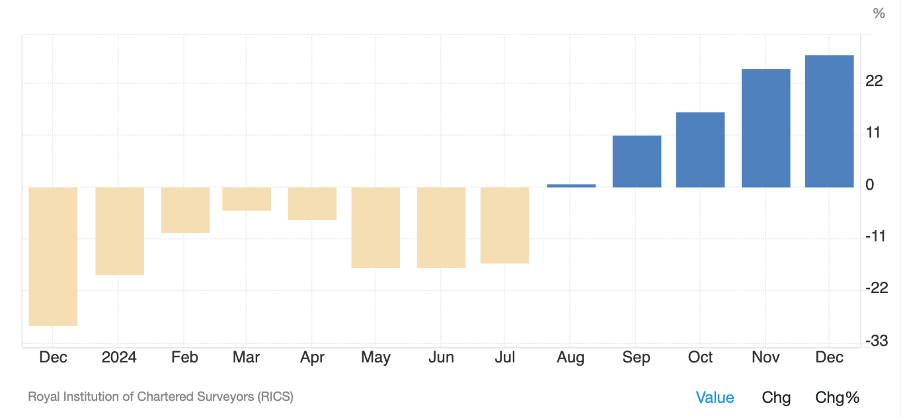
RICS Residential Market Survey Balance. Trading Economics, 2025
China
New home prices in China continue to decline year over year. In December, the drop was the softest since the summer, at 5.7%. We are now at 18 consecutive months of decreases in new homes despite continuous efforts to stimulate the economy (monetary easing, lower mortgage rates, lower buying costs, looser regulation on the property market).
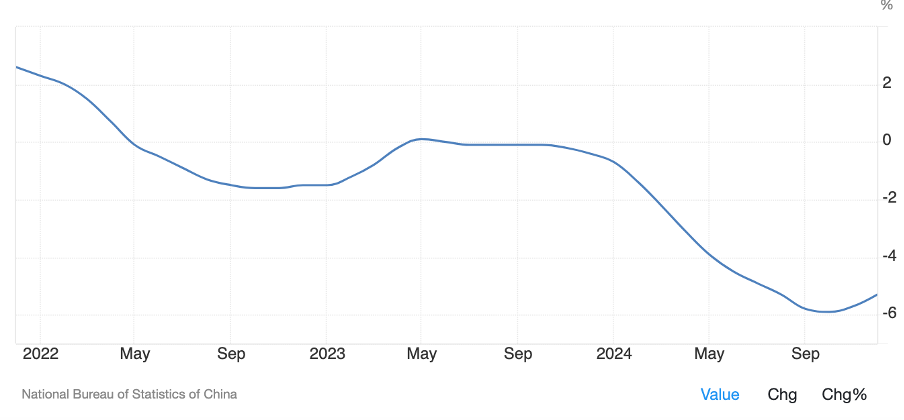
Newly Built House Prices YoY. Trading Economics, 2025
China’s house Price Index MoM decreased by 0.10% in December from a -0.50% drop in November.
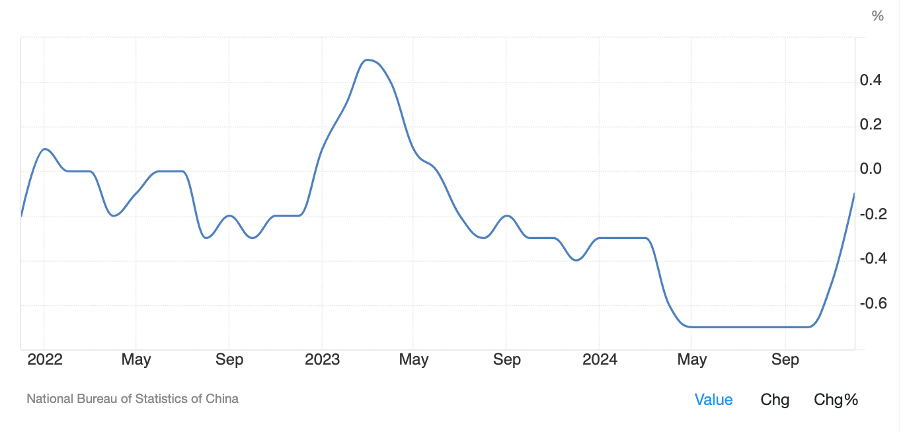
House Price Index YoY. Trading Economics, 2025
On the macro front, the latest important data release has been more positive. GDP growth (5.4% vs. 5% expected), retail sales (3.7% vs. 3.2% expected), and industrial production (6.2% vs. 5.5% expected) are all surprising to the upside. It remains to be seen whether this will finally impact the housing market.
WANT MORE?
We’ll make it easy for you! Upgrade to Premium and gain an edge in the markets with industry-leading insights and analysis.
References
(n.d.). US Treasuries Yield Curve. US Treasuries Yield Curve. https://www.ustreasuryyieldcurve.com/
(n.d.). CME FedWatch Tool. CME Group. https://www.cmegroup.com/markets/interest-rates/cme-fedwatch-tool.html
(n.d.).Trading Economics. Trading Economics. https://tradingeconomics.com/united-states/nahb-housing-market-index
(n.d.).Goldman Sachs. Goldman Sachs. https://www.goldmansachs.com/
(n.d.).Bloomberg. Bloomberg. https://www.bloomberg.com
(n.d.). FRED. Federal Reserve Economic Data. https://fred.stlouisfed.org/
Disclaimer
Wizard of Soho LLC and Weekly Wizdom publish financial information based on research and opinion. We are not investment advisors, and we do not provide personalized, individualized, or tailored investment advice, nor do we provide legal advice or information. The publisher does not guarantee the accuracy of the information provided on this page. All statements and expressions present are based on the author's or paid advertiser's opinion and research. Directly or indirectly, no opinion is an offer or solicitation to buy or sell the securities or financial instruments mentioned.
As news is ever-changing, the opinions included should not be taken as specific advice on the merits of any investment decision. Investors should pursue their investigation and review of publicly available information to make decisions regarding the prospects of any company discussed. Any projections, market outlooks, or estimates herein are forward-looking and inherently unreliable. They are based on assumptions and should not be construed to be indicative of actual events that will occur.
Contrarily, other events that were not considered may occur and significantly affect the returns or performance of the securities discussed herein. The information provided is based on matters as they exist on the date of preparation and do not consider future dates. As a result, the publisher undertakes no obligation to correct, update, or revise the material in this document or provide any additional information. The publisher, its affiliates, and clients may currently or foreseeably have long or short positions in the securities of the companies mentioned herein. They may, therefore, profit from fluctuations in the trading price of the securities. There is, however, no guarantee that such persons will maintain these positions. Unauthorized reproduction of this newsletter or its contents by photocopy, facsimile, or any other means is illegal and punishable.
Neither the publisher nor its affiliates accept any liability for any direct or consequential loss arising from any use of the information contained herein. By using the website or any affiliated social media account, you consent and agree to this disclaimer and our terms of use.